IoT monitoring platforms
Introduction
Nowadays, due to the rise of the Internet of Things (IoT), a large amount of information is generated continuously. For this reason, the processing, management and analysis of such information is a key aspect in today’s world, which has led to the creation of new technological fields such as Big Data or Machine Learning.
Thus, the growing need to clearly and accurately represent the available information has led to the existence of several solutions and platforms where data is displayed through multiple types of graphs and tables in real time.
In recent years, the Multimedia Communications Group has developed solutions for displaying data from real-time sensors.
Optical and electrical sensor monitoring and representation
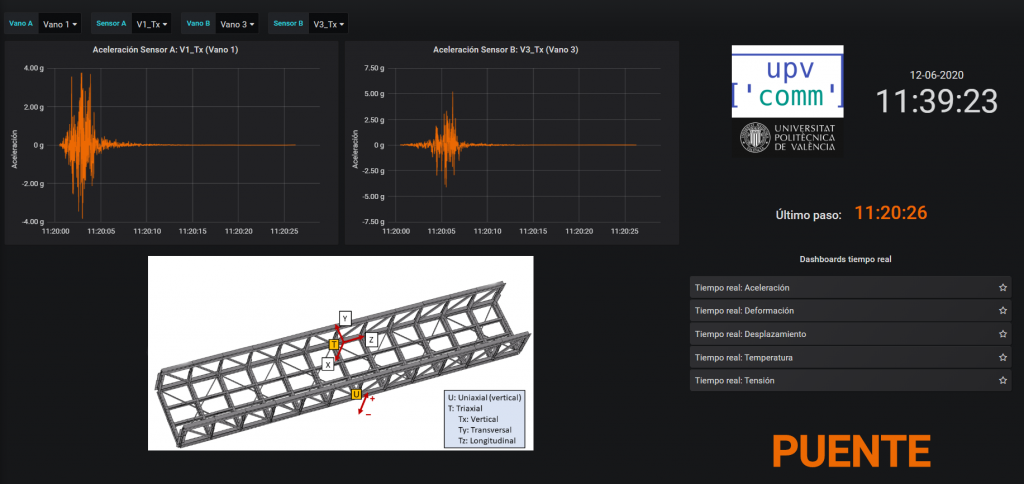
In a joint work with the company CalSens, the Multimedia Communications Group has developed a monitoring platform for optical sensors that have been installed on various bridges.
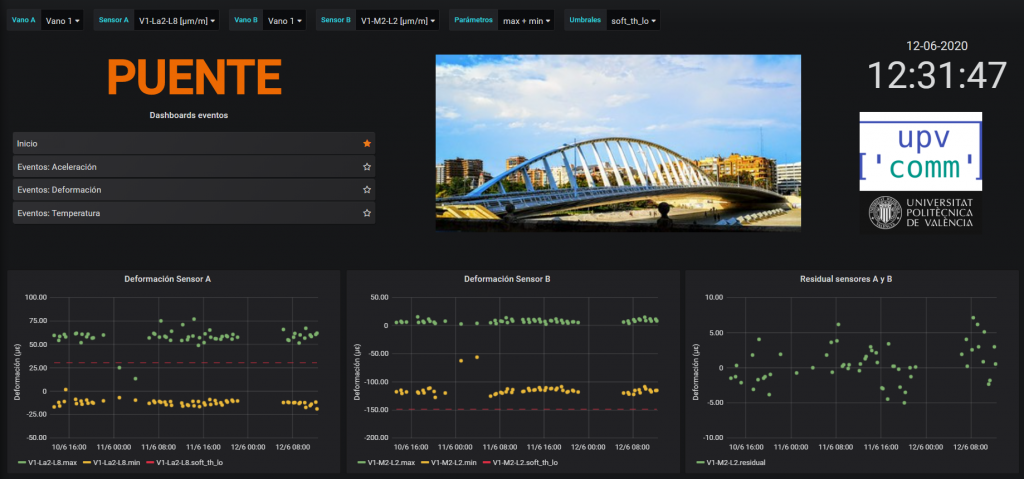
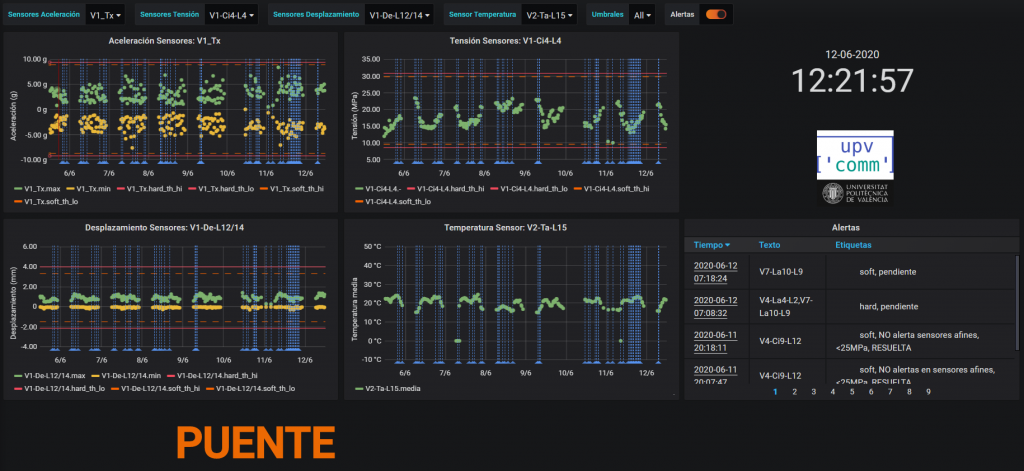
Through different dashboards developed with the Grafana framework, each dashboard displays information about the available sensors of different types (acceleration, deformation, temperature …) of each of the spans that make up the bridge. Through different graphics it is possible to see real-time information as well as summary information of each train step (such as maximum or minimum displacement, average temperature, etc.).
In addition, the solution allows to keep track of the alerts that have been generated because the sensors have measured values that are outside the defined thresholds.
On the other hand, below you can see two demonstrative videos of another sensor monitoring platform developed by the Multimedia Communications Group, which shows how the events produced on the bridge are transferred to the viewing platform in real time (the first video has text in Spanish).
Audio sensor monitoring
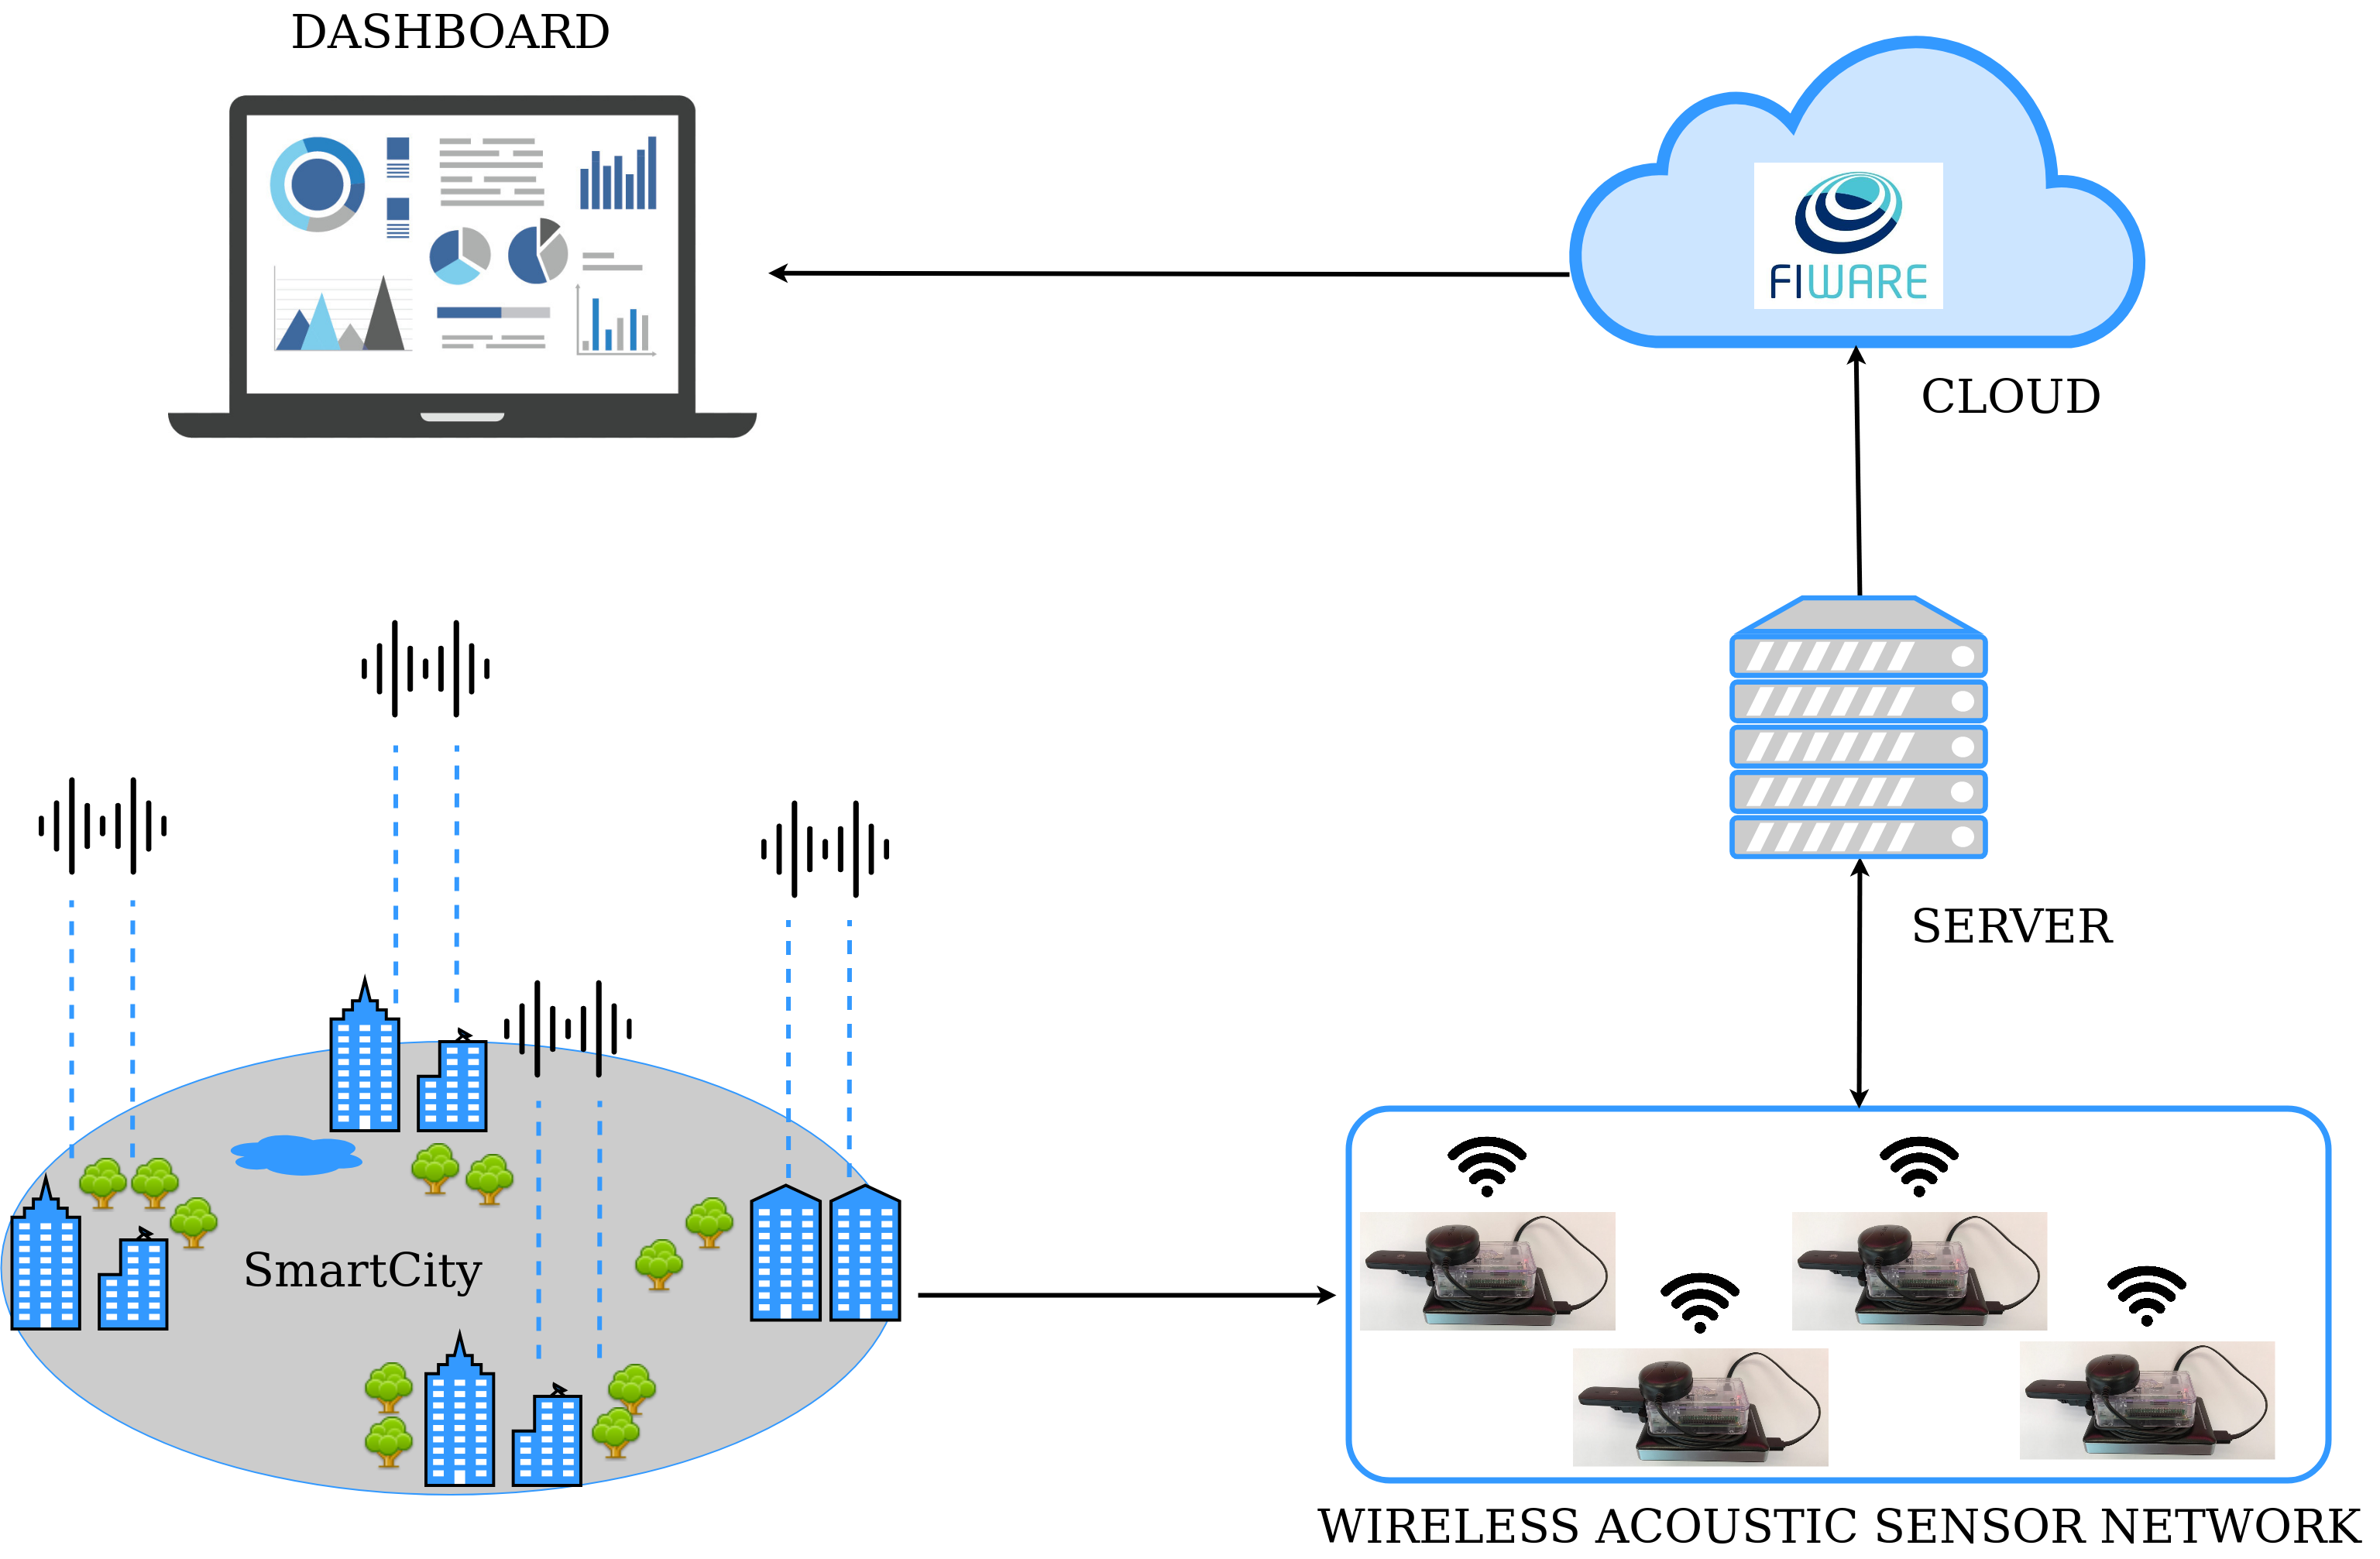
Within the SSPressing project, the Multimedia Communications Group has developed a network of audio sensors for noise monitoring. The different sensors communicate with each other through an ad hoc network, and there is a node that acts as a gateway in charge of uploading data from neighboring nodes to a central server. Through a visualization platform it is possible to know in real time the noise level at each point.
In the following videos you can see how the platform works (the second video has Spanish language).